QUnit.reporters.perf
version added: 2.7.0.
Description
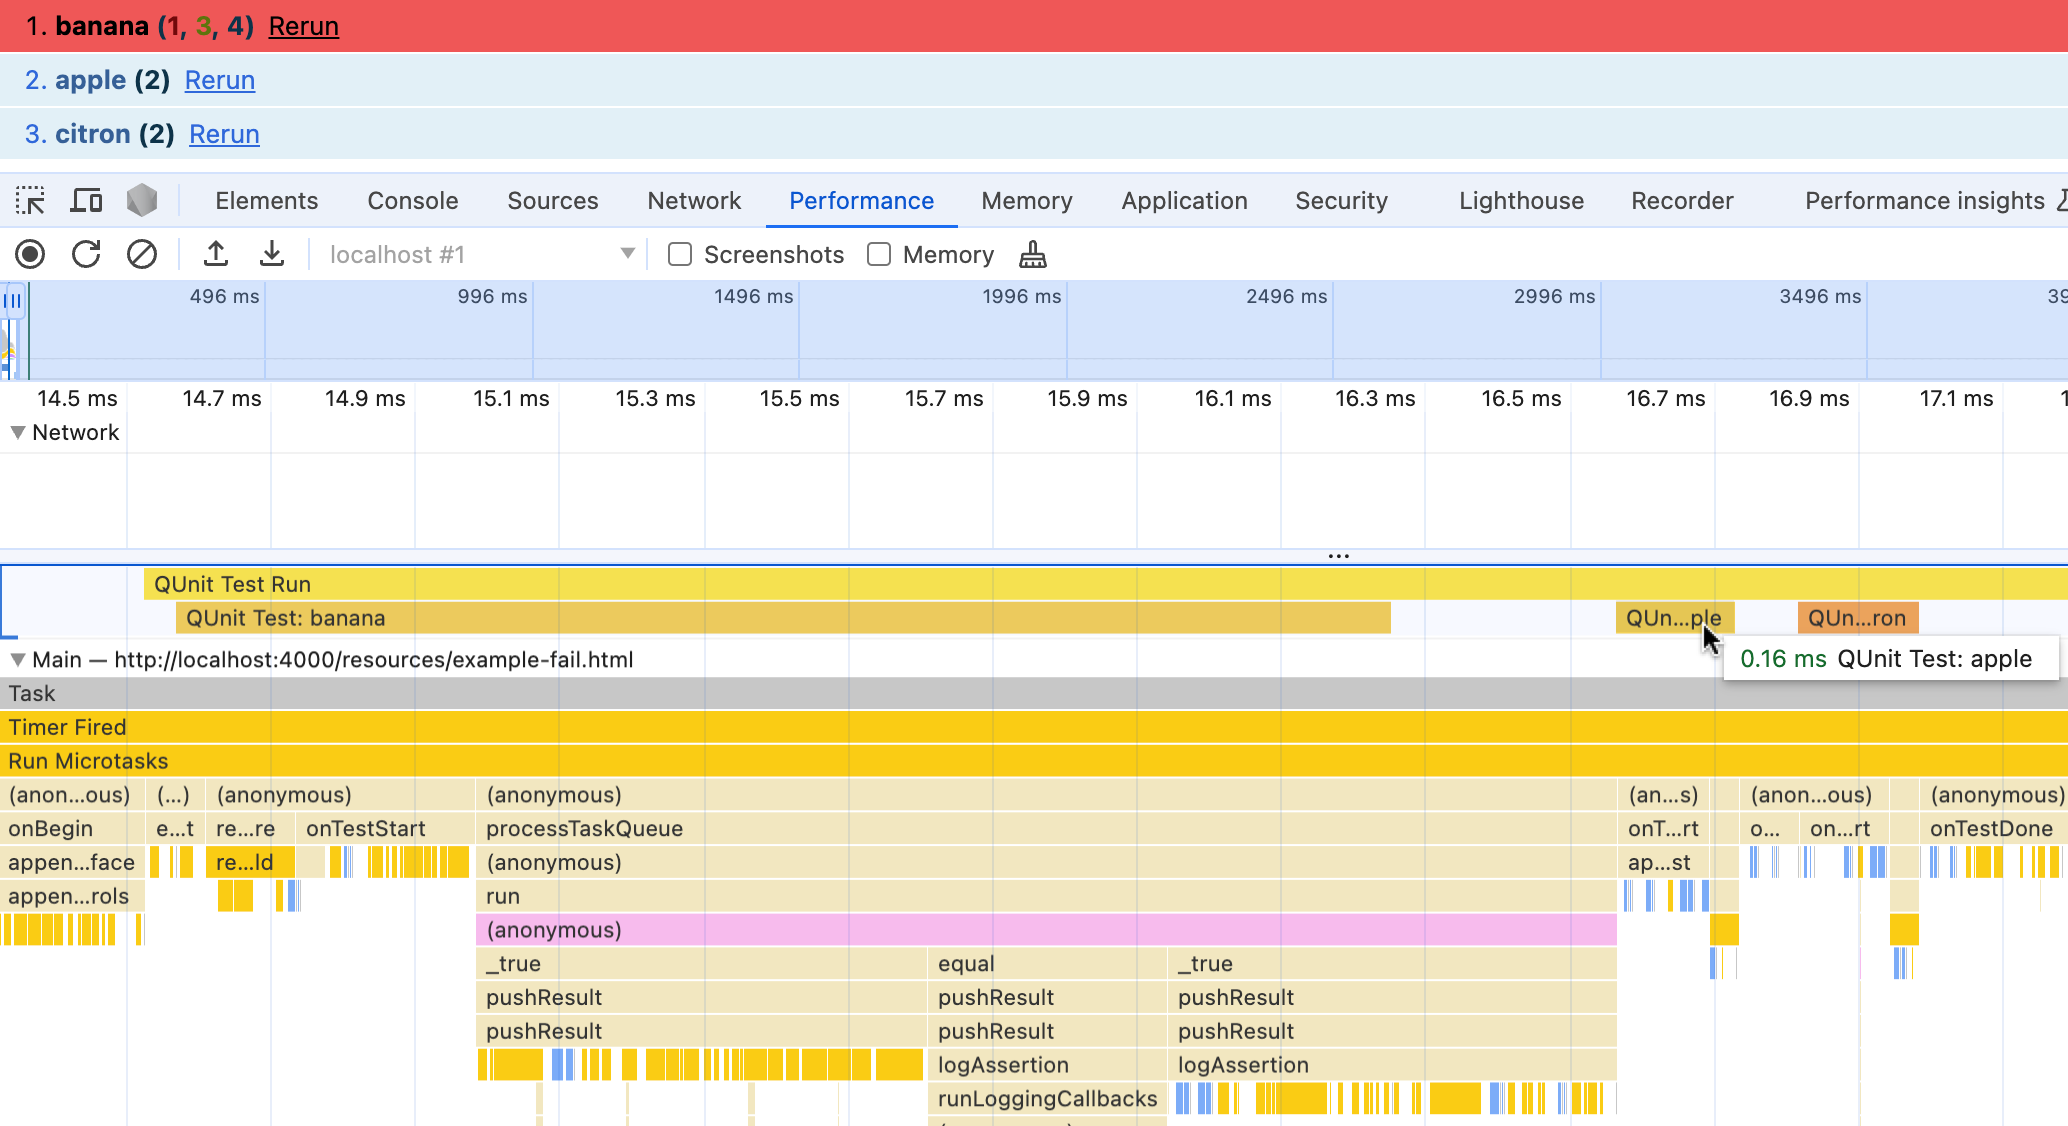
The perf reporter measures the duration of each QUnit test and each module, which you can then access in the browser dev tools to understand where time is spent during your test run.
This uses the performance.measure() method of the User Timing API, which adds each measure to the Performance Timeline.
Browser usage
QUnit enables the perf reporter by default in Browser environments. The measures are automatically included in Firefox Profiler and Chrome DevTools (Safari is pending WebKit #213870).
QUnit Run
└── QUnit Module: Example
    ├── QUnit Test: apple
    ├── QUnit Test: banana
    └── QUnit Test: citron


Node.js usage
The Web Performance API is also available in Node.js, and the QUnit perf reporter can be enabled in Node.js since QUnit 3.0.
You can enable it in the QUnit CLI via --reporter perf, or activate it explicitly from a setup file as:
QUnit.reporters.perf.init(QUnit);
Note: As of 2025, the Node.js inspector does not yet send User Timing measures to Chrome DevTools (upstream nodejs/node#47813).
This means that you can retrieve the QUnit measures from performance.getEntries() and export or visualise them with tooling of your own (e.g. from a runEnd event, or via a PerformanceObserver).
But, when connecting Chrome DevTools to a Node.js process, these are not currently visualised. If you currently test frontend code for browsers via jsdom in Node.js, consider testing in a real browser instead.
Changelog
| UNRELEASED | Exposed via QUnit.reporters.perf for programmatic use in Node.js (85716a9714), and declaratively via QUnit.config.reporters.perf. |
| QUnit 2.7.0 | Introduced as part of the HTML Reporter, always enabled. |
